WatticsAir - Indoor Display
 by Kayleigh-Ann Myles
If you have followed the training material chronologically to this point, then you are aware of how to access the Indoor Display WatticsAir feature. Let's do a little recap and ensure that we know how to access the Indoor Display WatticsAir feature.
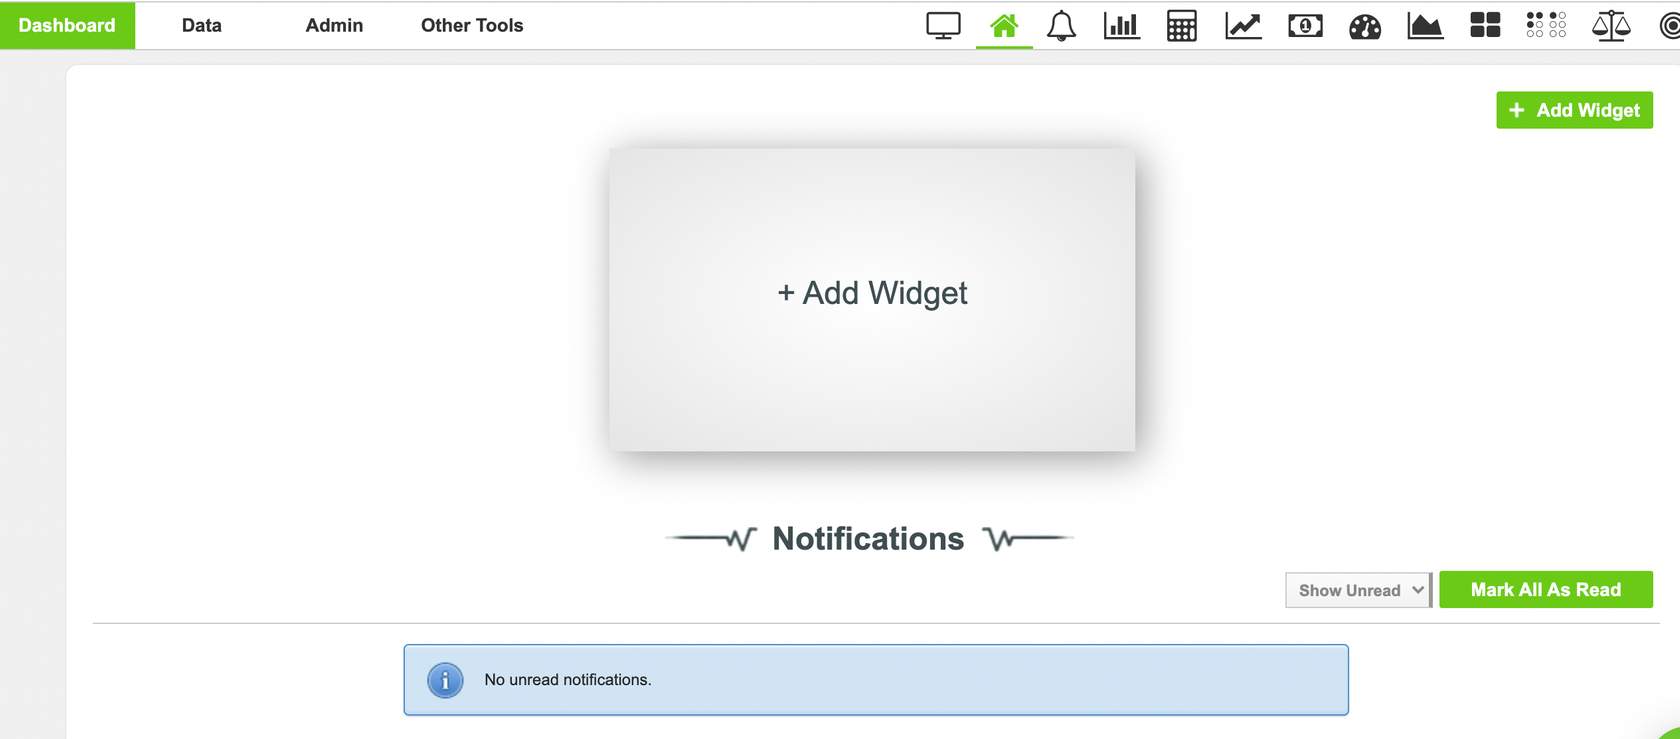
To access the WatticsAir Indoor display feature you select
The Bell icon
The TV display icon
The Home icon
The Indoor Display option organises all the parameters we discussed in the previous section into a stunning display, so you and your customers, can see your energy and air quality performance in real time.
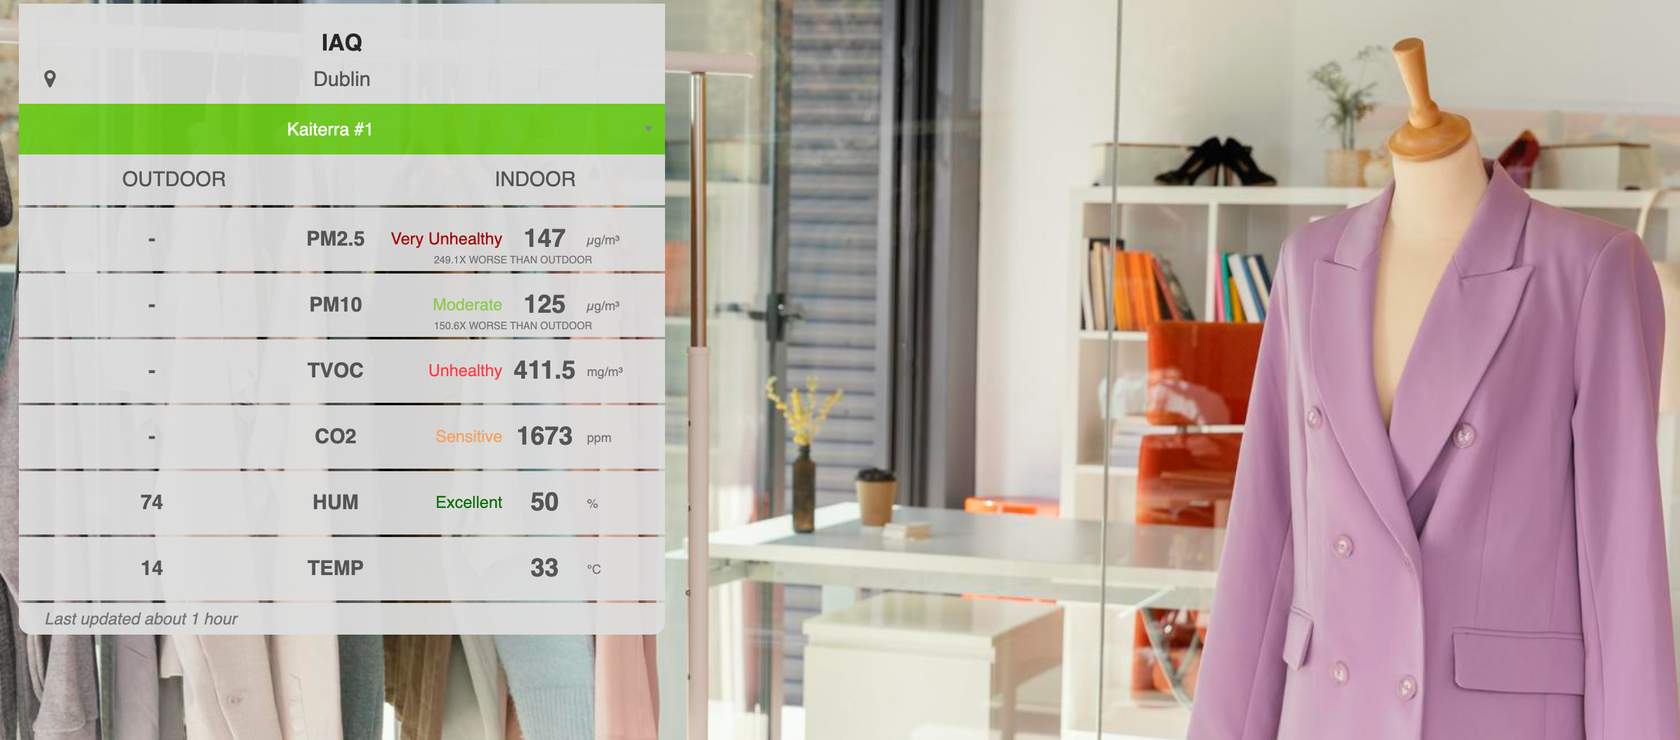
Example of the WatticsAir Indoor Display page
The data that is visible in the KioskView are the readings from your air quality monitors and sensors as well as other meters & data sources associated with your sites. You can compare your indoor air quality performance with outdoor air quality too. The outdoor air quality data that you see is collected from local weather stations based on the site’s location.
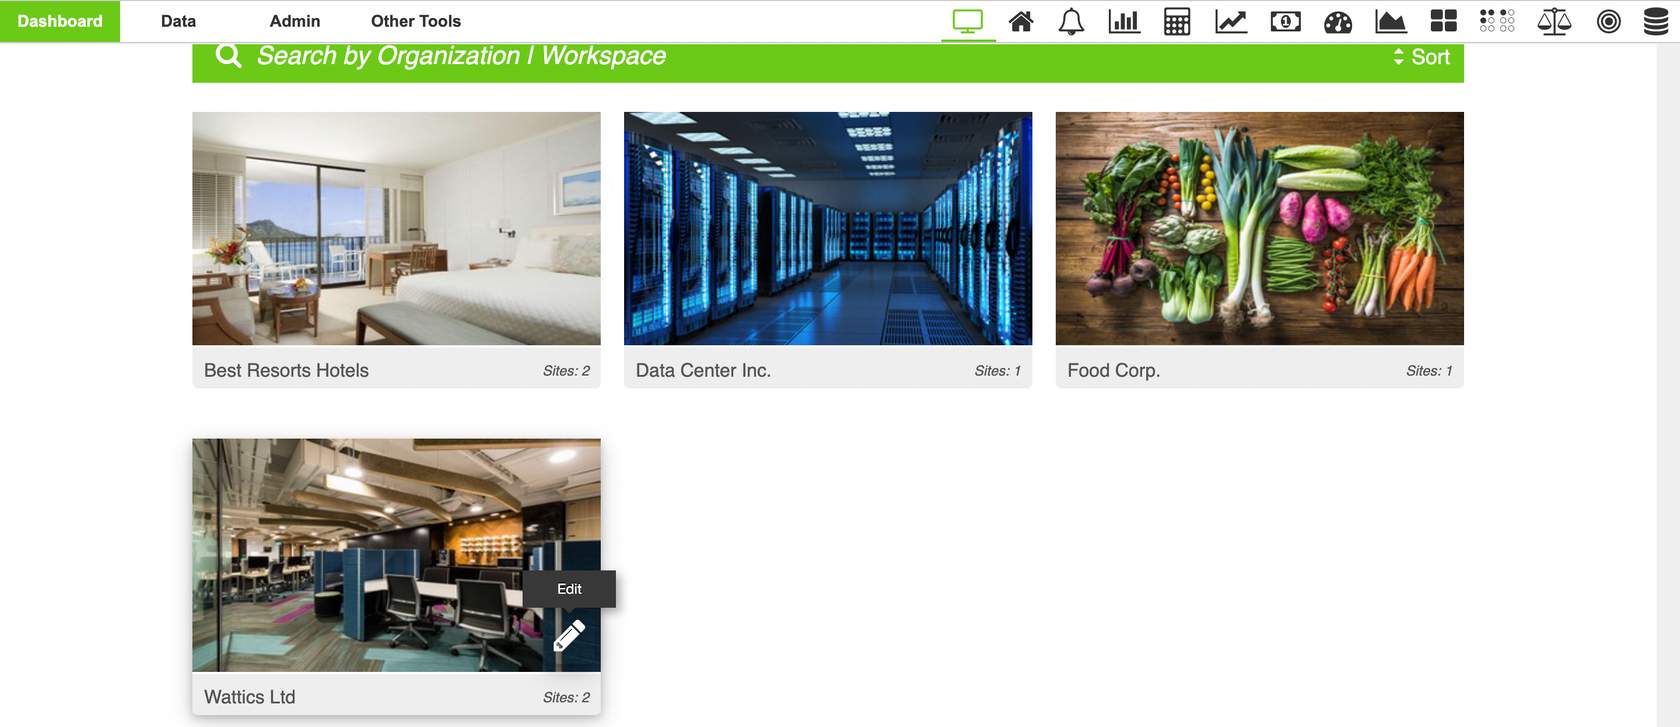
Customizing your sites and organizations could not be more simple. All you have to do is select the pencil icon which shows when you hover over a site image and you will be brought to the editing page displayed in the + option below. Let's go check it out.
The parameters you see in the display are configurable, therefore, you select to display the parameters that are most important for your or your clients’ buildings/facilities. i.e. TVOC, PM 2.5, Co2, kWh consumption and so on.
After you customize your page, there is also an option to share the display page with anyone you wish to share the data too (seen in the information icon above). This option is password protected so you can ensure the only people accessing the material are those whom you wish to see it. This tool is specifically useful for following a specific viral index (LEED, RESET, WELL etc.)
And.. thats a wrap for the display page. We are so proud of you, you are one step closer to mastering your WatticsAir tool. If you are ready, follow us to the next and final step, where we explore the different analyses available across the dashboard with your air quality data.
Believe you can and you're halfway there
Theodore Roosevelt